Vancouver, British Columbia, Canada, February 13, 2020, Klondike Gold Corp. (TSX.V: KG; FRA: LBDP; OTC: KDKGF) (“Klondike Gold” or the “Company”) is pleased to report exploration results including assays from thirty-six drill holes from the 2019 drill program plus one area of channel sampling testing the Lone Star Zone along the Bonanza Fault on the Company’s wholly owned 586 square kilometer Klondike District Property, Yukon Territory. The drill program was designed to test the Bonanza fault for Lone Star style mineralization over an additional 750m of strike length to the SE of the Lone Star zone, in an area of high gold-in-soil values up to 0.8 g/t Au. The program was successful in intersecting broad zones of gold mineralization containing local intervals of high-grade gold. The Company’s latest interpretation however suggests the main ‘Lone Star’ mineralized horizon has been fault offset slightly south and was untested in 2019 and remains a high priority target for 2020 drilling.
SUMMARY
DRILL RESULT HIGHLIGHTS
LONE STAR ZONE DRILL RESULTS
Assay results for samples from thirty-six (36) drill holes (LS19-284 to LS19-319) are newly reported here. The thirty-six holes were drilled in an area of 300 meters wide by 700 meters (along strike) located east of the known Lone Star mineralized zone. Mineralization in drill holes reported here extends the known envelope of Lone Star Zone mineralization along the Bonanza Fault for up to 400 meters to the east and provides information for drill targeting further potential expansion in 2020. (Refer to Figure 1: Location Plan Map of Lone Star Zone drilling.)
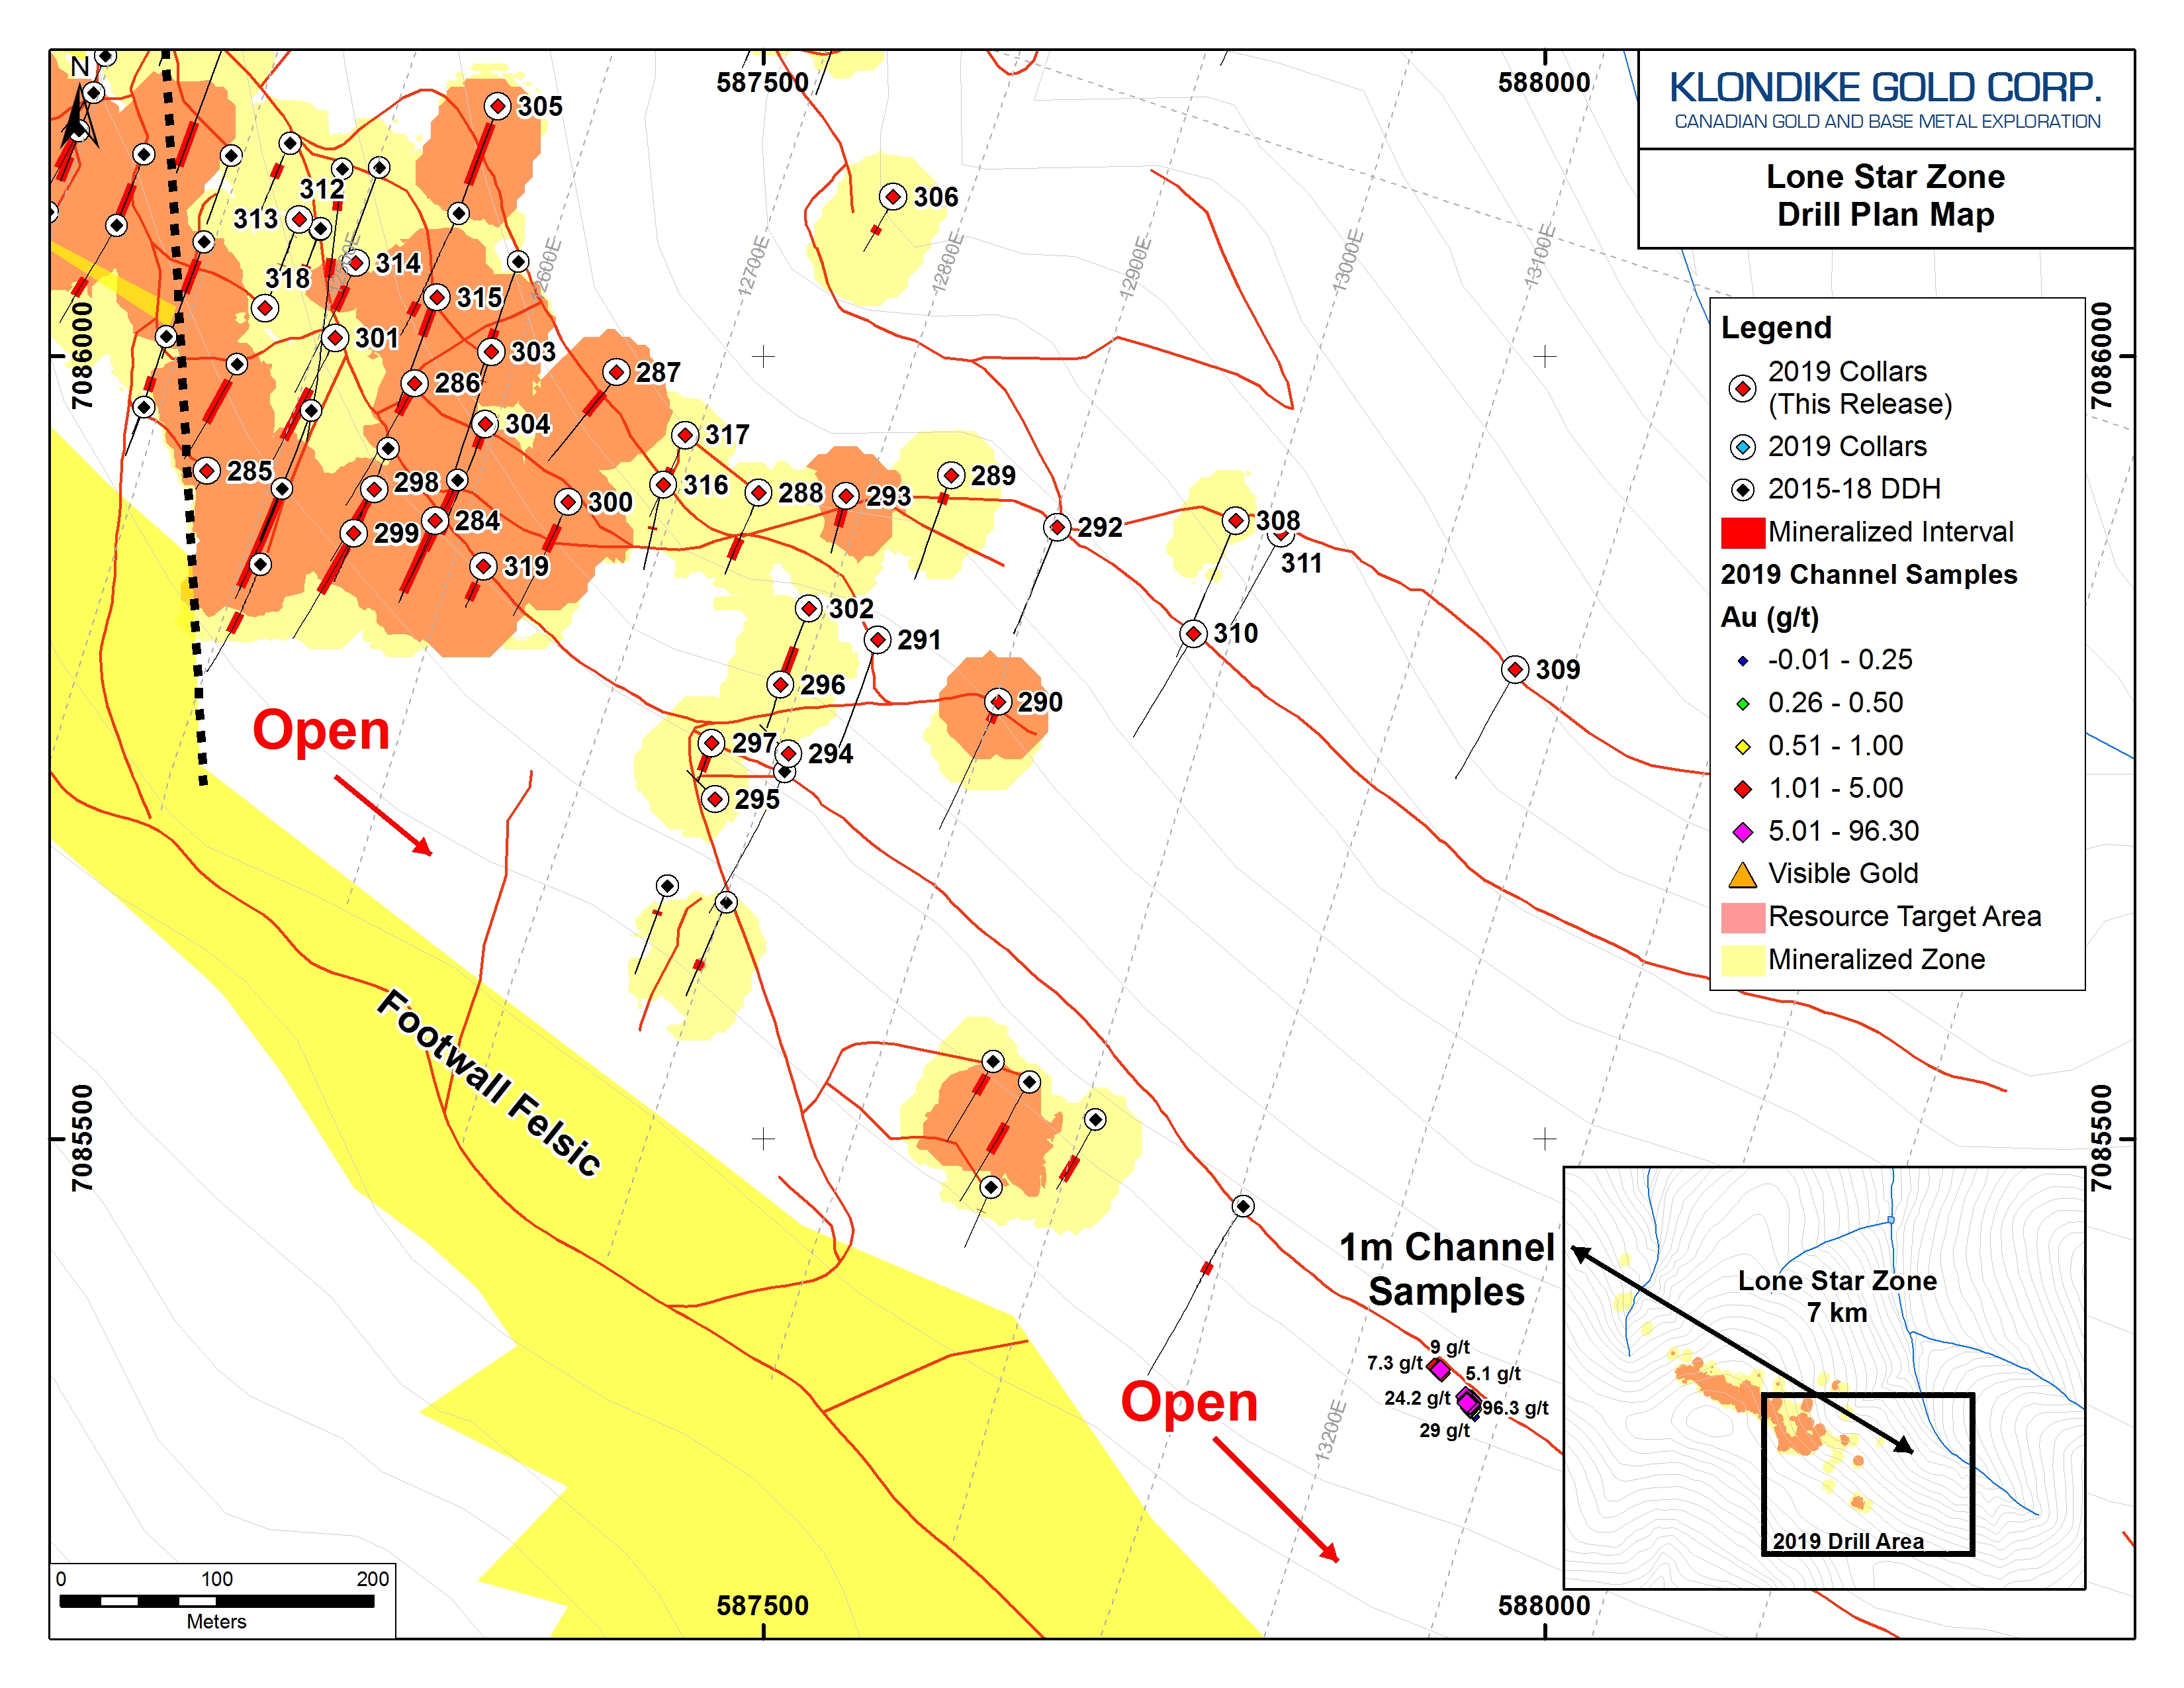
Figure 1: Location Plan Map of Lone Star Zone drilling.
Significant intersections from these thirty-six holes are listed in Table 1 below.
Table 1: Results from Lone Star Zone new drill holes LS19-284 to LS19-319.
| Hole ID | From (m) | To (m) | Au (g/t) | Length (m) |
| LS19-284 | 4.00 | 87.00 | 0.60 | 83.00 |
| including | 35.00 | 51.50 | 1.91 | 16.50 |
| LS19-285 | NSA | |||
| LS19-286 | 5.60 | 34.60 | 0.51 | 29.00 |
| LS19-287 | 26.90 | 57.50 | 0.56 | 30.60 |
| LS19-288 | 56.00 | 81.50 | 0.28 | 25.50 |
| LS19-289 | 21.10 | 33.00 | 0.33 | 11.90 |
| LS19-290 | 5.30 | 23.80 | 0.84 | 18.50 |
| LS19-291 | NSA | |||
| LS19-292 | NSA | |||
| LS19-293 | 5.90 | 35.50 | 0.32 | 29.60 |
| LS19-294 | NSA | |||
| LS19-295 | NSA | |||
| LS19-296 | NSA | |||
| LS19-297 | 8.95 | 34.00 | 0.22 | 25.05 |
| LS19-298 | 3.00 | 64.30 | 0.39 | 61.30 |
| LS19-299 | 15.80 | 73.00 | 0.27 | 57.20 |
| LS19-300 | 28.20 | 59.60 | 0.69 | 31.40 |
| including | 28.20 | 46.00 | 1.09 | 17.80 |
| LS19-301 | 63.00 | 126.00 | 0.20 | 63.00 |
| including | 124.00 | 126.00 | 2.58 | 2.00 |
| LS19-302 | 46.30 | 80.30 | 0.35 | 34.00 |
| LS19-303 | 33.75 | 35.00 | 1.59 | 1.25 |
| LS19-304 | 3.35 | 28.00 | 0.24 | 24.65 |
| and also* | 115.70 | 129.54 | 0.52 | 13.84 |
| LS19-305 | 20.00 | 92.50 | 0.48 | 72.50 |
| including | 51.50 | 72.00 | 1.25 | 20.50 |
| LS19-306 | 36.80 | 45.50 | 0.73 | 8.70 |
| LS19-307 | NSA | |||
| LS19-308 | NSA | |||
| LS19-309 | NSA | |||
| LS19-310 | NSA | |||
| LS19-311 | NSA | |||
| LS19-312 | NSA | |||
| LS19-313 | 43.30 | 44.30 | 0.52 | 1.00 |
| LS19-314 | 28.00 | 56.80 | 0.41 | 28.80 |
| LS19-315 | 4.35 | 46.00 | 0.35 | 41.65 |
| LS19-316 | 14.00 | 14.60 | 1.21 | 0.60 |
| LS19-316 | 50.00 | 53.30 | 0.95 | 3.00 |
| LS19-317 | 41.00 | 50.00 | 0.42 | 9.00 |
| LS19-317 | 57.40 | 58.40 | 3.14 | 1.00 |
| LS19-318 | 51.00 | 52.00 | 0.73 | 1.00 |
| LS19-319 | 20.80 | 41.00 | 1.45 | 20.20 |
NOTES:
The true thickness of reported drill intervals cannot be determined with the information currently available.
NSA: no significant assay
*Hole LS19-304 ended in mineralization.
LONE STAR ZONE GEOPHYSICAL MODEL OVERVIEW
The Lone Star Zone gold mineralization and associated Bonanza Fault is marked in geophysics by a coincident intense conductive northwest trending very low frequency electromagnetic (“VLF-EM”) high and a magnetic ‘break’ indicative of a major “D3” structure as defined in the Company’s orogenic gold model (see News Release December 10, 2019). Recent compilation of work has recognized a 3 km extension of the “D3” structure to the northwest. The combined VLF-EM/magnetic target, associated with gold mineralization in outcrop, gold-in-soils, and gold intersected in drilling, is now traceable across the northwestern end of the Klondike District Property for a distance of 7 kilometers.
As currently understood, the location of the seven-kilometer long Lone Star Zone and the fifteen-kilometer Stander Zone are shown in Figure 2.
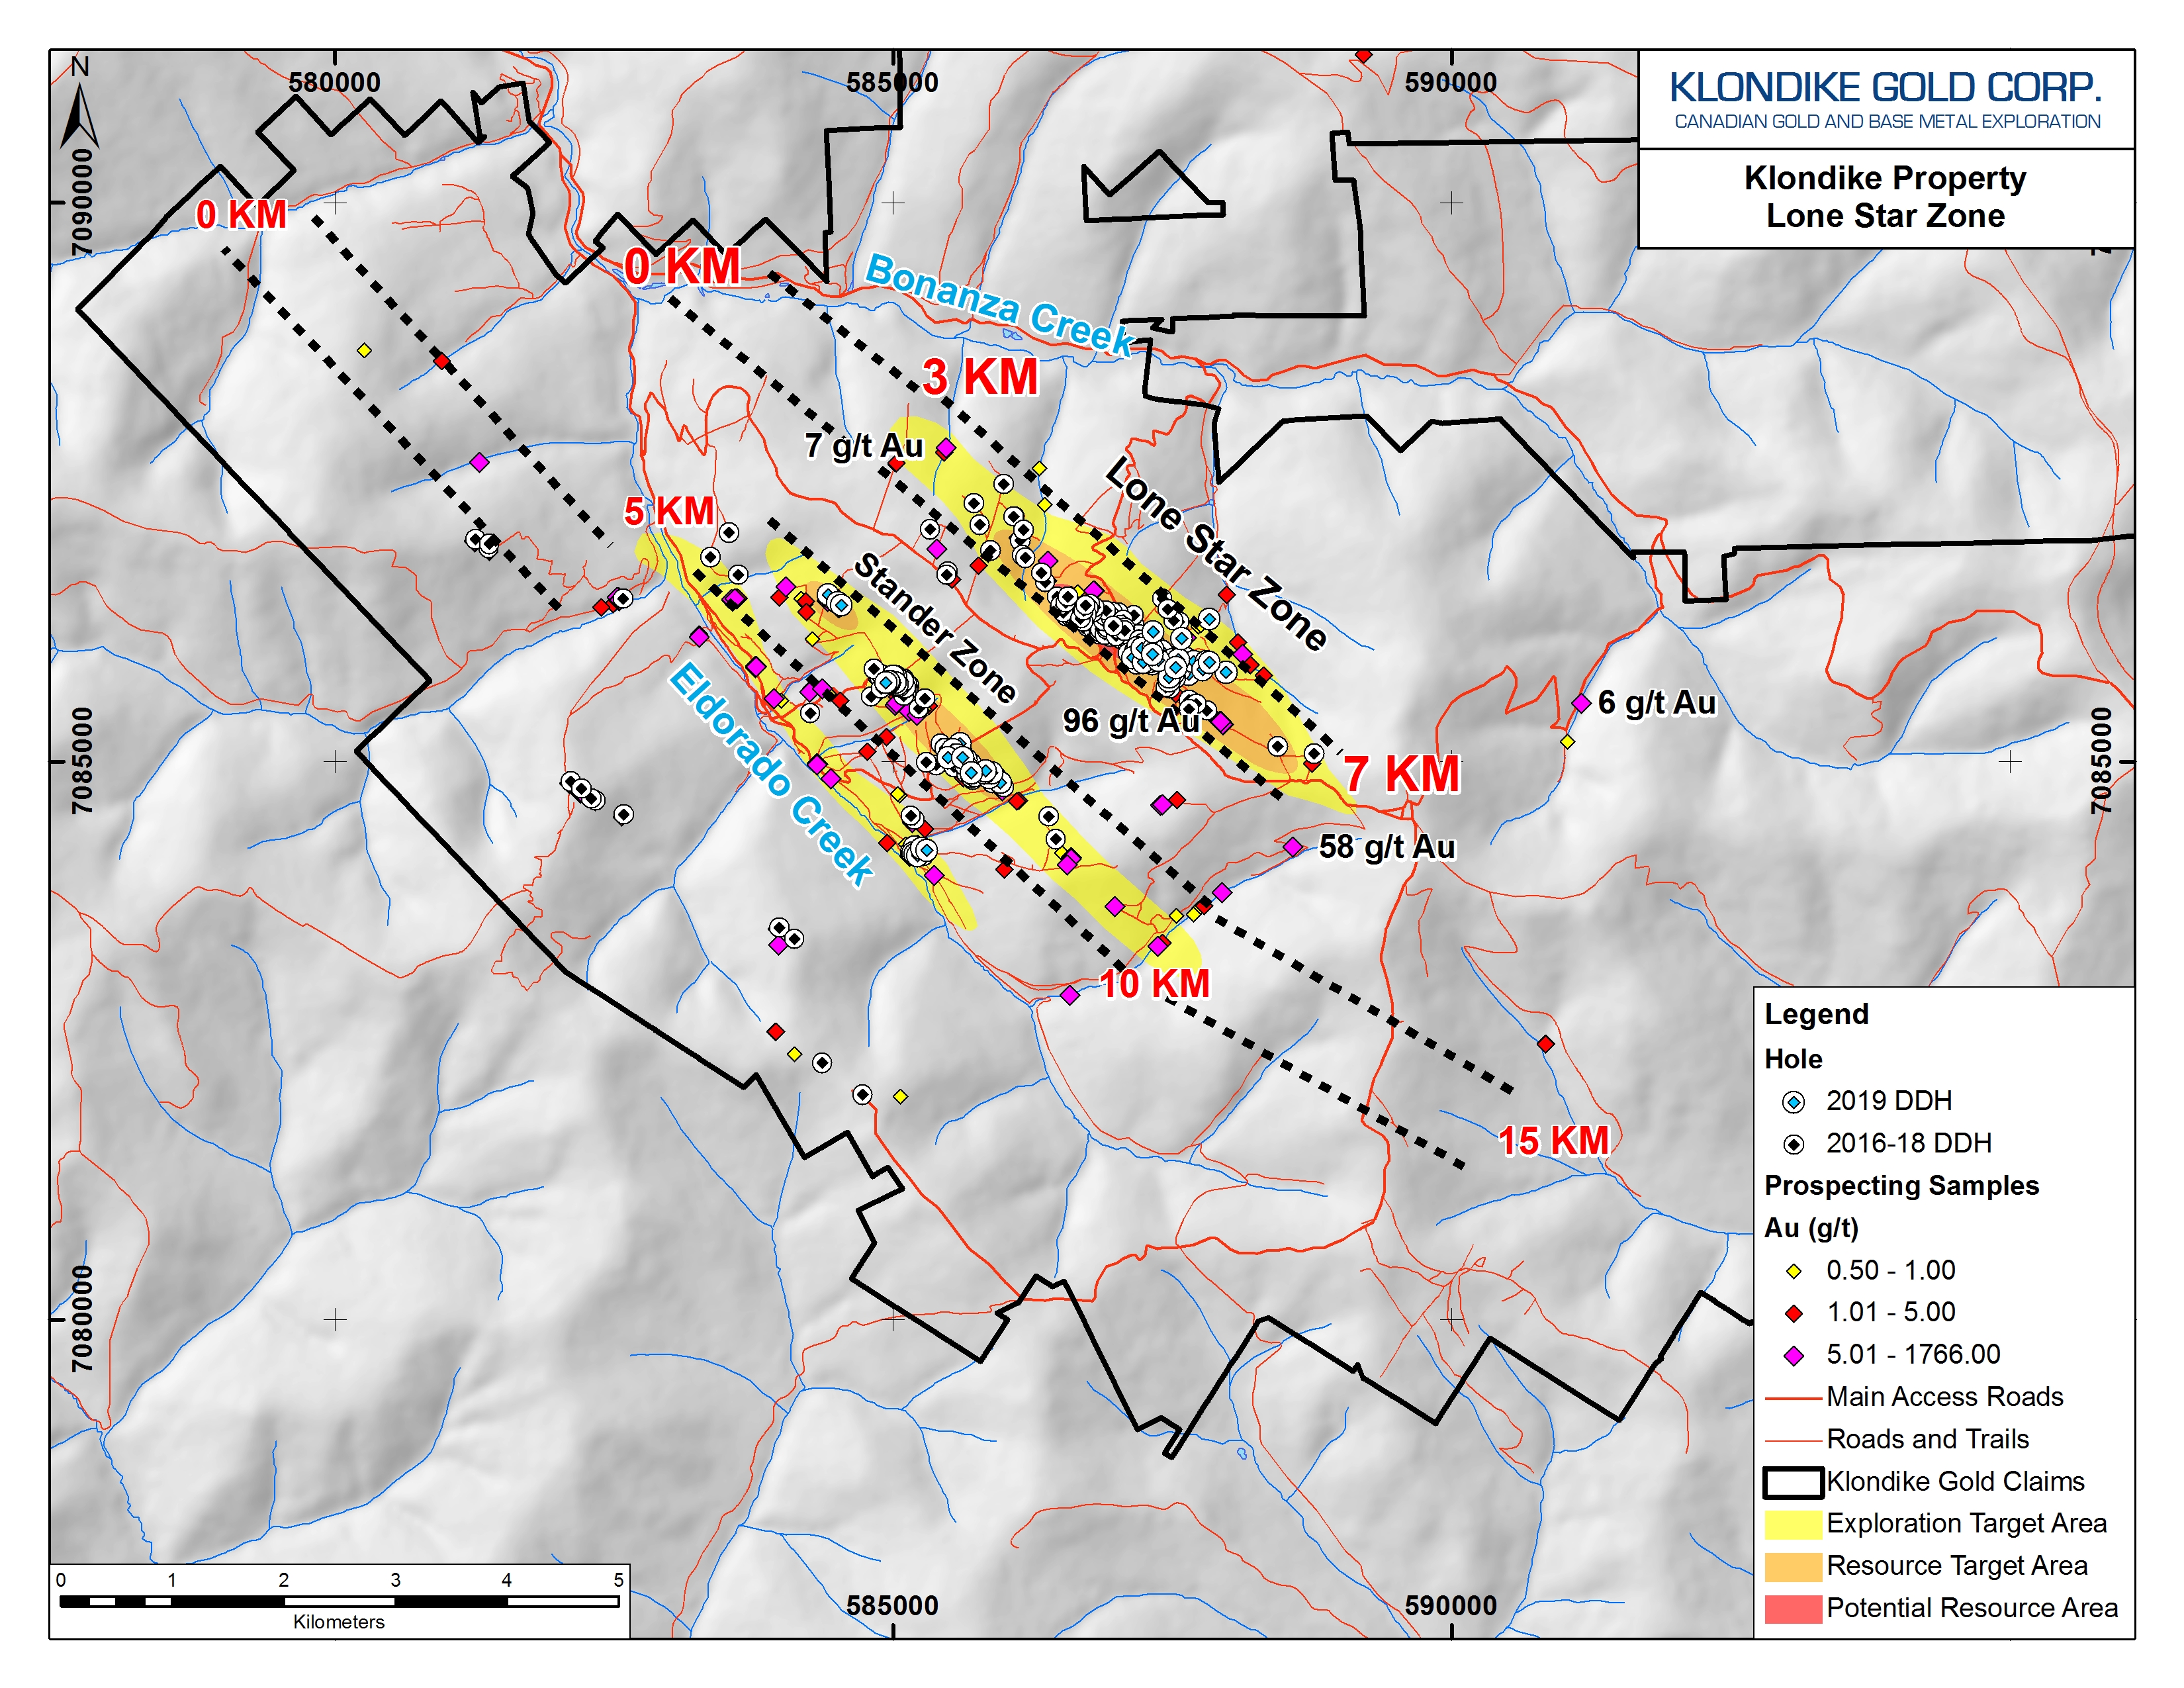
Figure 2: Location of Lone Star Zone and Stander Zone Segments
The northwest 3-kilometer segment of the Lone Star Zone from “Km 0” to Km 3 has seen little systematic exploration, aside from soil sampling (which returned numerous anomalous gold values) and the airborne geophysics.
LONE STAR ZONE GOLD MINERALIZATION
Within the Lone Star Zone and continuing along the “D3” northwest striking and southwest dipping Bonanza Fault, gold mineralization occurs within localized zones of quartz veining and disseminated along microfractures. Both the Bonanza Fault, and also the nearby Nugget Fault (Stander Zone), are composite fault zones ranging from 30 to 150m wide. The later northeast strike and northwest dipping “D4” faults (orthogonal to “D3” in orientation, forming a checkerboard pattern), were conduits for the introduction of gold mineralization. The D4 faults apparently reactivated the earlier D3 structures, and both are considered conduits and deposition sites for gold-bearing mineralization.
Measured from the northwest end, gold along the Bonanza Fault occurs in drill holes at surface between approximately Km 3.5 and Km 7.0. (The Lone Star Zone area of closer-spaced drilling is from Km 4.6 to Km 5.6.) The gold is coarse, visible free gold usually 1-mm in size but occasionally occurs in larger clots to >1-cm size, hosted by quartz veining. Individual quartz veins range in size from 1 millimeter to 10 millimeters and rarely up to 1.0+ meters. As currently known, gold mineralization occurs mostly adjacent to and above (in the hangingwall of) the controlling Bonanza Fault.
LONE STAR ZONE CHANNEL SAMPLE RESULTS
Seven prospecting grab samples were collected in 2018 from a sub-cropping quartz vein discovery within the Bonanza Fault containing visible gold located 850 meters east of the eastern end of the Lone Star Zone. Samples assayed between 14.5 g/t Au to 38.5 g/t Au (average 25.1 g/t Au). Prospecting grab samples are selective in nature collected to test for the presence or absence of gold and other ‘economic’ minerals. Systematic additional test results may vary significantly.
A trenching program in 2019 exposed the quartz vein discovery along a strike of 24 meters. The quartz vein and adjacent veinlets dips shallowly to the northeast consistent with veins noted locally in the Lone Star Zone. The true thickness of the mineralization is indeterminate.
The quartz vein exposure contains visible gold. A total of 29 channel samples cut by rock saw were collected from approximately 1-meter spaced lines continuously across the 1- to 4-meter wide exposures over a 24-meter strike length. Individual samples were 1.0 meter in length. A total of 11 composite channels were cut orthogonally across the 24-meter length and each ranged from 1.0 to 4.0 meters in total length. The objective of this work was to systematically examine the gold distribution through the length of the quartz vein and better understand the distribution of higher grade ‘pockets’ of gold-bearing quartz veins generally.
All channel samples contained gold. The highest composite channel assay result was 28.2 g/t Au over 4.0 meters at the 4-meter mark along the exposure including a 96.3 g/t Au over 1.0 meter subinterval with visible gold. An adjacent composite channel assay interval at the 3-meter mark was 11.1 g/t Au over 3.0 meters. The average gold assay value collectively for the 29 channel samples is 7.7 g/t Au. The 29 samples had a total mass of 112.9 kg (average 3.9 kg per sample) and the 112.9 kg bulk mass-weighted assay value is also 7.7 g/t Au. These channel samples are selective in nature collected to test for the presence or absence of gold. Systematic additional test results elsewhere may vary significantly. A table of composite channel sample assays is summarized in Table 2.
Table 2: Summary of composite channel sample assay results.
| Channel # (m) | Au (g/t) | Length (m) |
| 1 | 0.4 | 3.0 |
| 2 | 0.6 | 3.0* |
| 3 | 11.1 | 3.0 |
| 4 | 28.2 | 4.0* |
| including | 96.3 | 1.0* |
| 5 | 6.1 | 3.0 |
| 6 | 2.2 | 3.0 |
| 7 | 1.6 | 3.0 |
| 8 | 9.0 | 3.0 |
| 9 | 2.7 | 2.0 |
| 22 | 3.5 | 1.0 |
| 24 | 7.3 | 1.0 |
*Visible gold noted in 1-meter sample.
2019 DRILL ASSAYS PENDING
Remaining 2019 drill results from 54 holes testing various ancillary targets are pending release.
DRILL HOLE STATISTICS
Drill holes LS19-284 to LS19-319 were NTW-diameter size core. Drill holes are generally oriented with 200 azimuth and -55 dip at collar, except where noted in the following table. The purpose of varying collar dip and azimuth was to test for cross-cutting structures and to obtain structural measurements from the use of oriented core tools.
Location, azimuth, dip and end of hole (“EOH”) lengths for drill holes in this news release are listed in Table 3 below.
Table 3: Drilling Statistics
| Hole Number | Easting | Northing | Azimuth | Dip | EOH | Core Size |
| LS19-284 | 587290 | 7085895 | 200 | -55 | 100.58 | NTW |
| LS19-285 | 587144 | 7085927 | 210 | -55 | 24.45 | NTW |
| LS19-286 | 587277 | 7085983 | 200 | -50 | 140.21 | NTW |
| LS19-287 | 587406 | 7085990 | 200 | -55 | 123.44 | NTW |
| LS19-288 | 587497 | 7085913 | 200 | -55 | 100.58 | NTW |
| LS19-289 | 587620 | 7085924 | 200 | -55 | 122.83 | NTW |
| LS19-290 | 587650 | 7085779 | 200 | -55 | 155.45 | NTW |
| LS19-291 | 587573 | 7085891 | 200 | -55 | 131.06 | NTW |
| LS19-292 | 587688 | 7085891 | 200 | -55 | 124.97 | NTW |
| LS19-293 | 587553 | 7085911 | 200 | -55 | 66.14 | NTW |
| LS19-294 | 587516 | 7085746 | 320 | -50 | 40.84 | NTW |
| LS19-295 | 587469 | 7085717 | 320 | -50 | 40.23 | NTW |
| LS19-296 | 587511 | 7085790 | 200 | -55 | 50.29 | NTW |
| LS19-297 | 587467 | 7085753 | 200 | -55 | 47.24 | NTW |
| LS19-298 | 587251 | 7085915 | 200 | -55 | 89.92 | NTW |
| LS19-299 | 587238 | 7085887 | 200 | -55 | 129.54 | NTW |
| LS19-300 | 587375 | 7085895 | 200 | -55 | 140.21 | NTW |
| LS19-301 | 587226 | 7086012 | 200 | -55 | 176.78 | NTW |
| LS19-302 | 587529 | 7085839 | 200 | -55 | 100.58 | NTW |
| LS19-303 | 587326 | 7086003 | 200 | -55 | 140.21 | NTW |
| LS19-304 | 587322 | 7085957 | 200 | -55 | 129.54 | NTW |
| LS19-305 | 587330 | 7086160 | 200 | -55 | 150.88 | NTW |
| LS19-306 | 587583 | 7086102 | 200 | -55 | 68.72 | NTW |
| LS19-307 | 587832 | 7086274 | 200 | -55 | 165.81 | NTW |
| LS19-308 | 587802 | 7085895 | 200 | -55 | 170.69 | NTW |
| LS19-309 | 587981 | 7085800 | 200 | -55 | 140.21 | NTW |
| LS19-310 | 587775 | 7085823 | 200 | -55 | 135.03 | NTW |
| LS19-311 | 587831 | 7085887 | 200 | -55 | 121.28 | NTW |
| LS19-312 | 587203 | 7086088 | 200 | -50 | 60.05 | NTW |
| LS19-313 | 587203 | 7086088 | 200 | -75 | 70.1 | NTW |
| LS19-314 | 587239 | 7086060 | 200 | -55 | 160.02 | NTW |
| LS19-315 | 587291 | 7086038 | 200 | -55 | 129.54 | NTW |
| LS19-316 | 587436 | 7085918 | 200 | -55 | 100.58 | NTW |
| LS19-317 | 587450 | 7085950 | 200 | -55 | 100.58 | NTW |
| LS19-318 | 587181 | 7086031 | 20 | -55 | 74.68 | NTW |
| LS19-319 | 587321 | 7085866 | 200 | -55 | 50.29 | NTW |
SAMPLE AND ANALYTICAL PROTOCOLS
Lone Star Zone samples in this release are from NTW diameter drill core. Assay samples from drill core are cut using a diamond saw. Half the core sample interval is bagged, tagged, and sealed; the other half is returned to the core box with a corresponding tag and retained for reference. Three gold reference standards, blanks, coarse crush blanks, and sample duplicates are routinely inserted as part of Klondike Gold’s quality assurance / quality control (“QA/QC”) program, independent of and additional to the laboratory QA/QC program. A similar procedure is used for outcrop channel samples except all the individual sampled channel saw cut material is bagged for assay. See the Company website for additional information.
APPOINTMENT OF CHIEF FINANCIAL OFFICER
The Company further reports that Jasvir Kaloti has been appointed Chief Financial Officer of the Company to replace Jessica Van Den Akker. The Company would like to thank Ms. Van Den Akker for her contributions and wish her well in future endeavours.
QUALIFIED PERSONS REVIEW
The technical and scientific information contained within this news release has been reviewed and approved by Ian Perry, P.Geo., Vice-President Exploration of Klondike Gold Corp. and Qualified Person as defined by National Instrument 43-101 policy.
ABOUT KLONDIKE GOLD CORP.
Klondike Gold Corp. is a Vancouver based gold exploration company advancing its 100%-owned Klondike District Gold Project located at Dawson City, Yukon Territory, one of the top mining jurisdictions in the world. The Klondike District Gold Project targets gold associated with district scale orogenic faults along the 55-kilometer length of the famous Klondike Goldfields placer district. To date, multi-kilometer gold mineralization has been identified at both the Lone Star Zone and Stander Zone, among other targets. The Company is focused on exploration and development of its 586 square kilometer property accessible by scheduled airline and government-maintained roads located on the outskirts of Dawson City, YT within the Tr’ondëk Hwëch’in First Nation traditional territory.
ON BEHALF OF KLONDIKE GOLD CORP.
“Peter Tallman”
President and CEO
(604) 609-6138
E-mail: info@klondikegoldcorp.com
Website: www.klondikegoldcorp.com
Neither the TSX Venture Exchange nor its Regulation Services Provider (as that term is defined in the policies of the TSX Venture Exchange) accepts responsibility for the adequacy or accuracy of this release.
Disclaimer for Forward-Looking Information
“This press release contains “forward-looking information” and “forward-looking statements” within the meaning of applicable securities laws. This information and statements address future activities, events, plans, developments and projections. All statements, other than statements of historical fact, constitute forward-looking statements or forward-looking information. Such forward-looking information and statements are frequently identified by words such as “may,” “will,” “should,” “anticipate,” “plan,” “expect,” “believe,” “estimate,” “intend” and similar terminology, and reflect assumptions, estimates, opinions and analysis made by management of Klondike in light of its experience, current conditions, expectations of future developments and other factors which it believes to be reasonable and relevant. Forward-looking information and statements involve known and unknown risks and uncertainties that may cause Klondike’s actual results, performance and achievements to differ materially from those expressed or implied by the forward-looking information and statements and accordingly, undue reliance should not be placed thereon.
Risks and uncertainties that may cause actual results to vary include but are not limited to the availability of financing; fluctuations in commodity prices; changes to and compliance with applicable laws and regulations, including environmental laws and obtaining requisite permits; political, economic and other risks; as well as other risks and uncertainties which are more fully described in our annual and quarterly Management’s Discussion and Analysis and in other filings made by us with Canadian securities regulatory authorities and available at www.sedar.com. Klondike disclaims any obligation to update or revise any forward-looking information or statements except as may be required.”